Of all the components of the hydrological cycle the elements of precipitation, particularly rain and snow, are the most commonly measured. Precipitation is generally expressed as accumulated depths of water caught over a horizontal surface (mm) in a time interval.
|
1 mm = 1 l/m2 = 10 m3/ha
|
(9.1)
|
The commonest instruments used to measure rainfall are rain gauges and rainfall recorders.
It is not physically possible to catch all rainfall or snowfall over a drainage basin; the precipitation over the area can only be sampled by rain gauges. Rain gauges have different capacities depending on the readings (daily or monthly). The rain gauge shows the total quantity of rainfall or snow collected usually in a day, or in a month (if the rain gauge is placed where the access is difficult).
Its components are:
Choosing the site where the collector will be set is very important, and must be representative for the area and characterized by the absence of obstacles in the neighbourhood. The OMM standards (1996) stipulate that the receptive surface of a rain gauge must be horizontal and placed at 1.50m above the soil surface.
| |
Figure 9.1 Hellmann's rain gauges [Musy, 2001]
The need for continuous recording of precipitation arose from the need to know, not just how much rain has fallen, but also when it fell and over what period.
Siphon rain recorder (float recording gauges)
Rain is stored in a cylindrical collecting chamber containing a float. Movements of the float are recorded by a pen trace on a chart. When no rain is falling the pen draws a continuous horizontal line on the chart; during rainfall, the float rises and the pen traces slopes upwards on the chart according to the intensity of rainfall. When the chamber is full the pen arm lifts off the top of the chart and the rising float releases a trigger interrupting the balance of the chamber, which tips over and activates the siphon. A counter-weight brings the empty chamber back into an upright position and the pen returns to the bottom of the chart.
Tipping-bucket rain gauge
Rain caught in the collector flows down a funnel into a two-compartment bucket of fixed capacity. When full the bucket tips to empty, and a twin adjoining bucket begins to fill. As the bucket is tipped, it activates an electric circuit, and the ensuing pulse is recorded on a counter. In many stations, particularly in remote locations, measurements are recorded on magnetic tape or solid-state event recorders and the cassette is usually changed at monthly intervals.
Optical precipitation gauge
The optical precipitation gauge can measure rain or snow; it measures the precipitation rate in relation to disturbance to a beam between an infrared light emitting diode and a sensor. These gauges can record directly on a data storage device that can be accessed by computer [Dingman, 2002].
Atmometers
These instruments can give direct measurement of evaporation, are simple, inexpensive, and easy to operate, but clean the porous surfaces from which the evaporation takes place.
Two types are described here:
The Piche evaporometer consists of a glass tube with one end closed. A circular disc of absorbent blotting paper is held against the open end by a small circular metal disc with a spring collar. Water in the tube hangs-up by its closed end, feeding it constantly. The tube is graduated in millimetres, and will give a direct reading of evaporation over a chosen period of time, usually a day. The tube holds an equivalent of 20 mm of evaporation; Water is replenished when necessary.
The Bellani atmometer consists of a graduated burette and a thin ceramic disc that provides the porous surface. The difference in burette readings over a specified time gives the measure of evaporation.
Percolation gauges
These instruments measure evaporation and transpiration from a vegetal surface, Et, and compare the tanks and pans used for measuring E0. There are different types of tanks and pans, having between 1-5 m diameter and 10-70 cm depth. They can be set at the soil surface, partially into the ground or in water. In all of these cases a distance between water and the upper part of the tank has to be maintained. Water variations in the tank, measured at established time intervals, reflect the evaporation. (More details can be found in Linsley, Kohler and Paulhus - "Hydrology for engineers", 1988)
There are many different designs and, in general, these are regarded as research tools. A cylindrical or rectangular tank about 1 m deep is set into the ground and filled with a representative soil sample supporting a vegetal surface [Shaw, 1988]. A pipe from the bottom of the tank leads surplus percolating water to a collecting container. Evaporation plus transpiration is given by the following equation:
|
Et = Rainfall - Percolation
|
(9.2)
|
Percolation gauges do not take into account changes in soil moisture storage. The measurements should be taken over a time period defined by instances when the gauge is separated, so that any difference in the soil moisture storage would be small.
Lysimetres
The lysimetre is an recipient set into the ground, open at the top, with drainpipe at the bottom and a weighing device underneath that improves Et measurements of percolation gauges. However, it is much more complex and more expensive to construct and maintain [Shaw, 1988].
Then:
|
Et = Rainfall - Percolation ±
Weight change
|
(9.3)
|
All units of measurements are referred to the area of the lysimeter orifice at ground level.
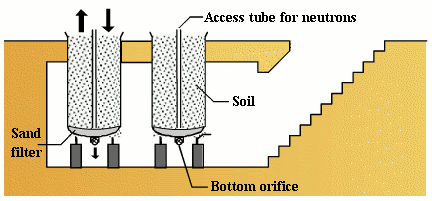 |
Figure 9.2 Lysimeter [Musy, 2001]
This method is based on the principle of constant charge. A graduated cylinder is set into the ground and maintains a constant water level (about 30 mm). Water level variations during a time interval determine the infiltration rate.
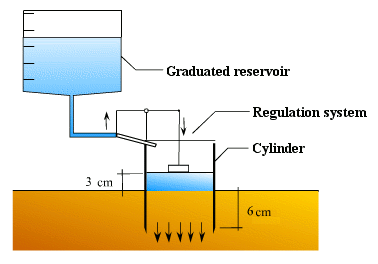 |
Figure 9.3 Mûntz's infiltrometre [Musy, 2001]
Two cylinders are set into the ground. Measurement is based on the principle of variable charge and allows assessment of vertical water infiltration.
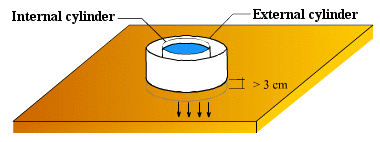 |
Figure 9.4 Infiltrometre with two cylinders [Musy, 2001]
This instrument is made of two concentric tubes. The inner tube allows air circulation and the outer tube allows water supply. Water introduced with a constant charge (3-25cm) passes through a small cylinder (~10 cm) fixed in soil. This method allows determination of hydraulic conductivity and sorptivity.
This instrument uses the principle of rainfall simulation. Infiltration is indirectly measured through the estimation of the groundwater table level.
The staff gauge is a base element for reading the level of a stream. A graduated staff is fixed vertically to the riverbank or according to the angle of slope, (but values obtained in this case must be corrected depending on the angle) at a stable point in the river, unaffected by turbulence or wave actions. The meter graduation should extend from the datum or lowest stage to the highest stage expected. The stage is read with an accuracy of ± 3 mm. All staffs should be made of durable material resistant to temperature changes and they should be kept clean especially in the range of average water levels [Shaw, 1988].
Depending on the regime of the river and on the availability of reliable observers, single readings of the stage at fixed time can provide a useful regular record.
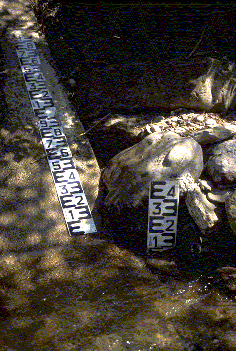 |
Figure 9.5 Staff gauges [Musy, 2001]
Crest gauges
There are several simple devices for marking the peak flood level in places where there is no continuous level recorder. The standard crest gauge consists of a 50 mm diameter steel tube perforated near the bottom and closed at the top with one or two holes under a lid to allow air to escape. Inside the tube is a removable rod that retains the highest watermark by means of a floating granular cork supplied near the base. The crest gauge is levelled into a normal staff gauge or benchmarked on the bank. The rod is cleaned and the crest gauge is reset after each reading. The main disadvantage of this device is that a sequence of minor peaks over a short period might be missed, the reading after such events giving only the highest peak level.
Autographic Recorders
The most reliable means of recording water level is the float operated chart recorder. To ensure accurate sensing of small changes in water level the float must be installed in a stilling well to avoid waves and turbulence from the main river flow. There are two basic mechanisms used by manufacturers:
The moving float looped over a geared pulley with a counterweight that activates a pen marking the level on a chart driven round on a horizontal clockwork drum.
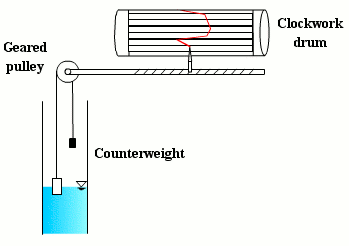 |
Figure 9.6 Scheme of a float recorder [Musy, 2001]
The level calibration of the chart should accommodate the whole range of water levels, but extreme peaks are sometimes lost. The time scale of the chart is usually designed to last a week, but the trace continues around the drum until the chart is changed or the clock stops.
The float with its geared pulley and counterweight turns the chart drum set horizontally, and the pen arm is moved across the chart by clockwork. With this instrument all levels are recorded, but the time scale is limited.
The most direct method to obtain a value of discharge that corresponds with a stage measurement is the use of the velocity-area method, in which flow velocities are measured at selected verticals of known depth across a measured section of the river.
The simplest method to determine flow velocity is timing the movement of a float over a known distance. Surface floats comprising any available floating object are often used in rough preliminary surveys; these measurements give only the surface velocity and a correction factor must be applied to give the average velocity over a depth.
Current meters
Current meters are reasonably precise instrument that can give a nearly instantaneous and consistent response to velocity changes, and the construction is simple and robust enough to withstand rough treatment in debris-laden flood flows. The instrument needs to be calibrated to obtain the relationship between the rate of revolutions of the cups or propeller, and the water velocity.
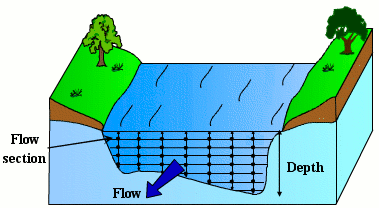 |
Figure 9.7 Flow and field of velocities through a cross section [Musy, 2001]
Electromagnetic method
The electromagnetic flow measurement method and the following ultrasonic method, are now well established:
The ultrasonic method uses pulses to measure the mean velocity at a prescribed depth across the river. This is a sophisticated form of the velocity-area method; the cross-section must be surveyed and water levels must be recorded.
The integrating-float technique developed recently [Sargent, 1981] uses the principle of moving floats by releasing compressed-air bubbles at regular intervals from special nozzles (From a pipe laid across the bed of the stream). Bubbles rising to the surface with a constant terminal speed Vr are displaced downstream, at a distance L from the surface by the effects of the flow velocity.
Dilution Gauging
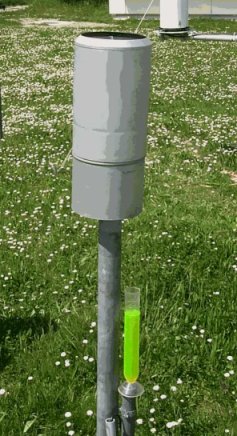
This method of measuring the discharge in a stream or pipe is made by adding a chemical solution or tracer of known concentration to the flow and then measuring the dilution of this solution downstream where the chemical solution is completely mixed with stream water.
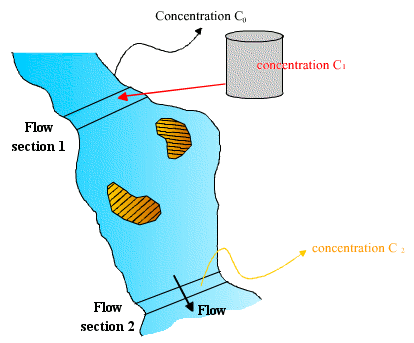 |
Figure 9.8 Principle of dilution measuring [Musy, 2001]
Musy, A. 1998. Hydrologie appliquée, Cours polycopié d'hydrologie générale, Lausanne, Suisse.
Musy, A. 2001. e-drologie. Ecole Polytechnique Fédérale, Lausanne, Suisse.
Morell, M. 1999. Acquisition et constitution d'une information hydrologique de base. Ed. HGA, Bucuresti, Romania.
Vladimirescu, I. 1978. Hidrologie. Ed. Didactica si Pedagogica, Bucuresti, Romania.