The cognisance of total rainfall is not directly useful for the assessment of the flood hydrograph since not all the precipitation fallen on a basin is transformed into runoff. During a precipitation event a part of it is subject to some retention in several layers of the soil as well as to some "losses" due to evapotranspiration. Thus, the first stage in deriving the runoff hydrograph starting from the total rainfall is to determine the sum of amounts of precipitation that do not enter into the process of runoff formation, and then by difference to estimate the rainfall quantity that is totally transformed into runoff. Conventionally, this last fraction of rainfall is defined as "effective rainfall" or "net rainfall". The term "effective rainfall" will be kept and the ensemble of procedures and/or models is named the production function. The process of conversion from the rainfall hyetograph to the runoff hydrograph is very complex as it depends on numerous hydrological, meteorological and physiographical catchment characteristics. That is why the production function will resort to some simplifying assumptions. In spite of these, relationships aiming to obtain effective rainfall are quite often accurate and lead to acceptable solutions of this problem.
This chapter aims to present the main methods and procedures allowing conversion from total rainfall to effective rainfall that is necessary to obtain the flood hydrograph corresponding to a certain rainstorm. In a first step some essential notions concerning the infiltration process is presented. The further step is devoted to the description of the main production functions and finally some commonly used methods for deriving effective rainfall are presented.
Some definitions are useful to be firstly considered, namely:
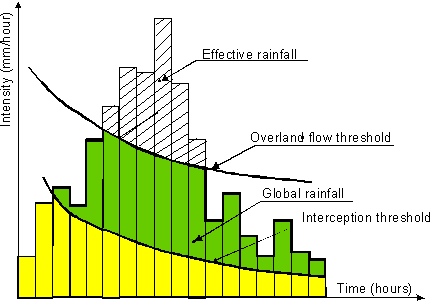
Total rainfall is the total quantity of rain that is measured above the vegetal cover of the land.
Global rainfall is the total rainfall diminished by the interception of land canopy, that is rainfall that reaches the land surface.
Effective rainfall is the remaining quantity of rainfall after subtracting losses. These losses consist in interception, storage within depressions, infiltration and evapotranspiration.
Interception represents the evolution in time of the quantity of rainfall that is caught by the vegetation cover, that is, the storage of water at the vegetation level. These values set out the global rainfall as other loses are negligible. Thus, evapotranspiration is very small during a rain event, while the storage in depressions is significant only in small karst basins.
The overland flow marks the evolution in time of the soil absorption capacity. This threshold sets out the effective rainfall. Figure 3.1 shows an example of above-mentioned thresholds.
Figure 3.1 Interception and overland thresholds
Total rainfall or shortly rainfall is the fundamental component of the water balance and it is the main input element to the hydrological system. Rainfall is measured by means of three types of instruments:
The interception is somehow difficult to be measured or evaluated. Its magnitude depends on the types of vegetation cover and its density, the duration and depth of rainfall, the continuum or discontinue character of the rain, the season that influences the stage of the vegetation growth, and on the soil wetness.
The interception may be an important component in the water balance equation, particularly for forest regions, as trees intercept the biggest water volume. On the other hand the mechanisms of the interaction between transpiration of canopy and intercepted water (intercepted water as a diminishing factor of the transpiration) has not been yet completely clarified (Aussenac, 1981). The difference between total rainfall and water stored on vegetation represents the global rainfall. From now on, while the term of rainfall is used this means global rainfall.
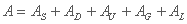
The following three components (Serban et al.) make the alimentation of the catchment channel network:
The sum of the three components makes the total runoff R:
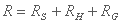 |
(3.1) |
Total runoff is then given by the water balance equation
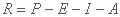 |
(3.2) |
| where: | ||
| P | global rainfall | |
| E | evapotranspiration | |
| I | infiltration | |
| A | variation of the water volume that is stored during the considered time step | |
Since the variables P, E, I and A are expressed as water depths, the total runoff will be the available water depth that flows into stream channels.
Evapotranspiration characterises the ensemble of phenomena that encompasses transpiration of the canopy, evaporation of water from several layers of the catchment (soil surface, unsaturated zone, free water surfaces, groundwater) as well as from the intercepted water by vegetation bodies. Evaporation is a function of meteorological conditions (temperature, radiation, wind, air humidity, cloudiness, etc.) and antecedent humidity while transpiration essentially depends on the type of vegetation, on the overture extent of the stomata and on meteorological characteristics of the atmosphere (humidity, temperature and wind).
Evapotranspiration E, produced at all levels of water storage, is given by:
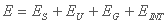 |
(3.3) |
| where: | ||
| ES | evaporation from the soil surface | |
| EU | evaporation from the inner soil by exfiltration | |
| EG | transpiration evaporation from the water table | |
| EINT | evaporation of the interception (from the canopy surface) | |
Infiltration constitutes the major element of runoff production processes. This will be treated further in a special way.
Water storage is formed with the flowing components:
 |
(3.4) |
| where: | ||
| AS | surface storage | |
| AD | depression storage | |
| AU | storage in the nonsaturated soil | |
| AG | storage in groundwater | |
| AL | groundwater loses | |
The depression storage is one of the most difficult to be estimated as it depends on micro-peculiarities of the topography of catchment slopes. For medium size basins, water caught in depressions seems to be not very significant compared with infiltration. Small basins located in carbonate rock areas, which show numerous and large karst formations (dolines or sinkholes), might be considered as having high water volumes that are stored during flood events. As a rule the depression storage is considered depending on the work scale of the hydrologist.
According to equation 3.1 and taking into account the components of the water balance function, the feeding process of the stream channel is differentially manifested function of meteorological circumstances that the river basin is experiencing.
During a rainfall event and/or snowmelt, the process of formation of all components RS, RH, RG takes place. Immediately after the rainfall stops, the component Rs becomes null but the processes of subsurface and groundwater flow formation continue. Consequently, total runoff begins to diminish and the infiltration keeps going on until the storage becomes zero (the basin slope becomes empty). The infiltrated volume becomes significant and water from unsaturated soil layers penetrates into deep layers of the soil and then to the groundwater table and the so-called "percolation" that feeds the groundwater storage. After some long time interval after the rain ceases evapotranspiration becomes the most contributing component in the water balance equation leading to the decreasing of the storage components AU and AG while percolation goes on to penetrate into the groundwater storage. During long periods without rainfall events, feeding of the river network is performed by the groundwater flow. In its turn the groundwater storage is diminishing primarily due to alimentation of the river channel and even by the evaporation (when the drought period is very long).
As the process of surface and subsurface flow practically lasts during the rainfall event and short time after rain stops, the other losses are negligible during this period. Therefore only infiltration would represent a major water component that has to be subtracted from global rainfall to obtain effective rainfall.
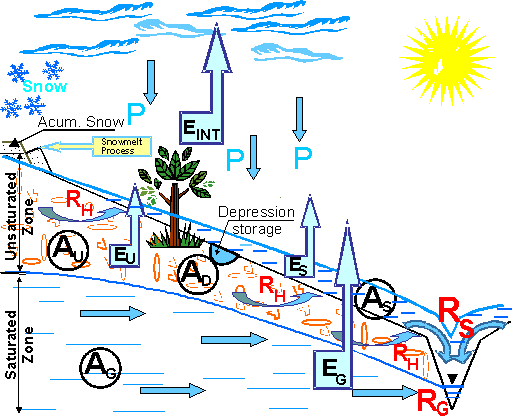
Figure 3.2. Components of the water balance in a basin
Summarizing, the hydrological process of runoff formation might be regarded in a systemic conception. The river basin acts as a system having a set of input components, an operator that is made of other components, each of them being found at a moment in a given state, and a set of output components.
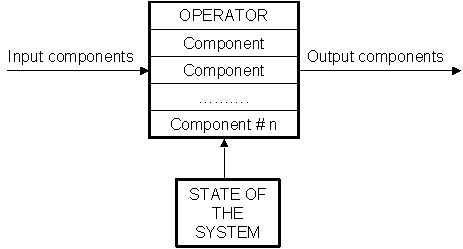
Figure 3.3. The scheme of a system
The last output components result as a response of the basin to the impulse given by the input components. The scheme of the system is given in Figure 3.3.
Looking at the scheme of the system represented in Figure 3.3 the input components are global rainfall and water equivalent resulted from the snowmelting process, and radiation and thermal energy coming from the sun and from the atmosphere.
The "operator" components are the interception, depressions, infiltration and percolation.
The output components are the runoff portions (overland, subsurface and groundwater flows) and the evapotranspiration.
The "state" of the system is given by the amount of the water storage components at a certain moment, namely the interception, the surface, the unsaturated and saturated storage, all of them being regarded as "reservoirs".
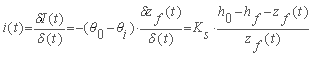
Infiltration is the process of the water penetration from the upper layers of the soil to deeper ones, when the soil receives rainfall or is exposed to flooding. First, infiltrated water fulfils interstices of the soil that are found at the surface and then it penetrates through the soil due to gravity. Infiltration acts in all three directions xyz. While infiltration is manifested in horizontal direction, the gravity force component is negligible and water moves under the influence of sorption forces only. While infiltration is vertically manifested, both the capillary force and the gravity one are active. Infiltration acts on intensity of runoff formation, on magnitude of evapotranspiration, soil humidity and groundwater storage. The following complementary definitions are to be mentioned:
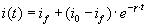
The infiltration regime or infiltration rate, is the flux of water that penetrates from the surface table into the soil, noted and expressed in mm/hour to be dimensionally comparable with rainfall intensity from which it is subtracted to give effective rainfall. Infiltration intensity primarily depends on the alimentation regime of the soil surface (rainfall, irrigation, flooding).
The cumulative infiltration represents the integral in time of the infiltration rate and represent the total volume that is infiltrated into the soil during a certain time step, expressed in mm:
 |
(3.5) |
| where: | ||
| I (t) | cumulative infiltration during the time t [mm] | |
| i(t) | infiltration intensity during the time t [mm/hour] | |
The infiltration capacity is the maximum flux of water that the soil is able to absorb while it is fed by a sufficient quantity of rainfall or a layer of water covers it.
The following factors influence infiltration:
For the same basin the most influencing "variable" factors are antecedent moisture conditions and intensity of the rain that produces the flood wave.
In Figures 3.4 and 3.5 the influence of the type of soil and the antecedent moisture conditions on the infiltration regime are presented.
Figure 3.4. Infiltration intensity function of time (After Musy, Soutter, 1991)
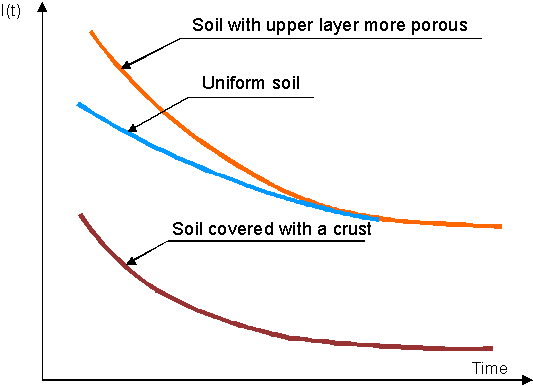
Figure 3.5. Infiltration intensity function of time in a uniform
and porous
soil as well as in a soil covered with a crust (Musy & Soutter, 1991)
Knowing that the soil characteristics over a catchment are non-homogeneous, and that wetness may substantially vary around the basin area, previous conditions of soil humidity at the scale of the catchment cannot be measured. Instead of measuring them, the wetness state of the basin is represented by an index that express the averaged precipitation fallen previously the flood triggering rainstorm. This index, introduced by the Weather Bureau of the USA is known as "Antecedent Precipitation Index" noted API.
The modelling of the infiltration process is achieved by two ways:
The empirical relationship expresses the decrease of infiltration intensity as a function of time, starting from an initial value to a limit value, which might be null. The mathematical expression of the function might be either an exponential, or a hyperbolic or a quadratic one.
Among them, the well-known formula of Horton with 3 parameters might be cited, as follows:
 |
(3.6) |
| where: | ||
| i(t) | infiltration intensity (mm/h) | |
| i0 | initial intensity of infiltration (mm/h) | |
| if | final intensity of infiltration (mm/h) | |
| t | time from the start of the rainfall event (h) | |
| γ | empirical constant value function of the type (nature) of the soil (1/nr) | |
The parameters of this type of formulae are derived by regression procedure, starting from data on the cumulative infiltration. The parameter i0 depends on the type of soil and the antecedent conditions of soil humidity; if is a constant depending on the type of soil while the parameter γ depends on both the soil type and the direction of the flow into the soil.
Parameters of the Horton formula for different type of soils are given in Tables 3.1 and 3.2.
Table 3.1 Parameters of the Horton formula for different types of soil (El-Jabi, 1987)
| Type of soil |
i0[mm/h] |
if[mm/h] |
γ [min-1] |
| Bare soil | 280 |
6-220 |
1.6 |
| Agrarian terrain with peat | 900 |
20-290 |
0.8 |
| Peat | 325 |
2-20 |
1.8 |
| Fine sand | 210 |
2.25 |
2.0 |
| Clay with peat | 670 |
10-30 |
1.4 |
Table 3.2 Initial capacity i0 and final capacity
of infiltration
function of the classes of soil as defined by SCS (Hillel,1974)
| Type of soil |
Group |
i0[mm/h] |
if[mm/h] |
| Sand, silt | A |
250 |
12-8 |
| Sandy limestone | B |
200 |
8-4 |
| Clay limestone | C |
130 |
4-1 |
| Clay | D |
75 |
1-0 |
The Horton method assumes that the overland flow starts immediately after the intensity of precipitation exceeds the infiltration capacity of the soil. This capacity varies in time in compliance with the illustration presented in Figure 3.6.
The Institute of Soil Management and Water of the EPFL adopted a simpler relation, as follows:
 |
(3.7) |
where: a and b are parameters that are determined by use of a regression procedure.
This relation has the advantage that allows for finding the functional relations between the limit capacity of infiltration if and the soil texture and between the parameter a and the volume humidity. For example, clay has been adopted as a characteristic of the soil texture. The existence of several relations that define the relation between the content in fine elements and the other hydrodynamic characteristics of the soil explain this choice (Musy, 1998). An example of the relation between the content in clay and the capacity of infiltration if is presented in Figure 3.7.
Figure 3.6. Distribution of effective rainfall according to the Horton Method
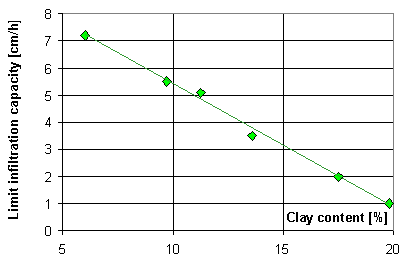
Figure 3.7. Influence of the content in clay on the limit infiltration capacity (Jaton, 1982)
Physically based models describe in a simplified way the water movement, especially at the limit of the wet front, as a function of several parameters.
For some particular initial and boundary conditions, Philip proposed a method for solving the equation of infiltration, as follows:
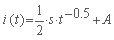 |
(3.8) |
| where: | ||
| i(t) | infiltration intensity [cm.s-1] | |
| s | sorptivity [cm.s-1/2] | |
| t | time [s] | |
| A | gravity component of the infiltration, function of hydraulic conductivity at saturation [cm.s-1] | |
Sorptivity represents the ability of the soil to absorb water when the flow is produced only under the action of the pressure gradient.
For the horizontal infiltration the component A = 0, so that:
 |
(3.9) |
Thus the sorptivity is defined as the infiltrated water layer in horizontal movement. It depends on the initial condition of soil humidity, and the boundary conditions of the system. The sorptivity is function of the initial water content in the soil, θi , under the circumstances that the water content at the surface, θ0 , is considered at saturation.
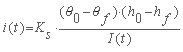
Another well-known model is that of Green and Ampt. This model is based on the simplified hypothesis that implies a schematisation of the infiltration process in compliance with Darcy law (Figure 3.8). This model gives acceptable results when applying it for a soil having a coarse texture.
The main hypotheses of this method are:
Based on Darcy law, the model encompasses the hydrodynamic parameters of the soil, as follows:
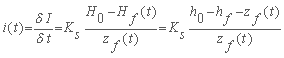 |
(3.10) |
| where: | ||
| i(t) | infiltration intensity [mm/h] | |
| I | cumulative infiltration | |
| t | time [hours] | |
| Ks | hydraulic conductivity at saturation | |
| H0 | total hydraulic head at surface [mm] | |
| Hf(t) | total hydraulic head at the level of the wetting front [mm] | |
| zf(t) | depth of the wetting front (depth of infiltrated water from the moment of the beginning of rainfall) [mm] | |
| h0 | pressure charge at the surface [mm] | |
| hf | pressure charge at the wetting front [mm] | |
According to the Green and Ampt model, the water content of the transmission zone is uniform as seen in Figure 3.8.
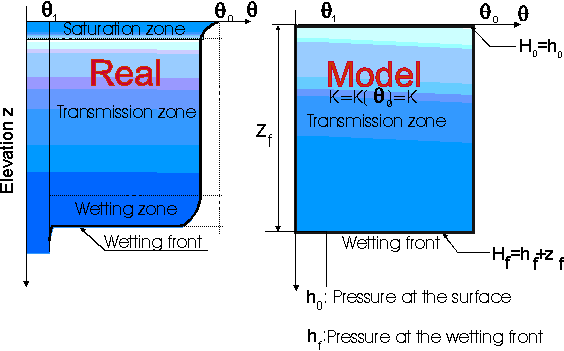
Figure 3.8. Schematisation of the infiltration process according to Green and Ampt (Musy & Higy, 1995)
Then, the cumulative infiltration results as the product of the variation in the water content and the depth of the wetting front, thus:
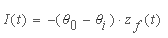 |
(3.11) |
| where: | ||
| I (t) | cumulative infiltration | |
| θ0 | water content imposed at the surface | |
| θi | initial water content of the soil | |
| zf(t) | depth of the wetting front | |
Combining the expression 3.10 and 3.11 one obtains:
 |
(3.12) |
For a horizontal flow, the infiltration conversely varies with the cumulative infiltration:
 |
(3.13) |
For a vertical flow and high t values, the infiltration intensity becomes by approximation:
 |
(3.14) |
The value of the pressure head at the wetting front is necessary to be experimentally determined.
Out of the above mentioned infiltration functions, there are numerous other functions proposed by different authors as presented in Table 3.3:
Table 3.3 Principal functions of infiltration intensity
| Author | Function | Legend |
| Kostiakov |  |
i(t): infiltration intensity in time[cm/s]; i0: initial infiltration capacity [cm/s]; if: final infiltration capacity [cm/s]; α : parameter function of soil conditions; |
| Green &Ampt | 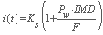 |
Ks: hydraulic conductivity at saturation; Pw: suction of water at the wetting front; IMD: initial water deficit; F: depth of infiltrated water from the beginning of the alimentation. |
| Dvorak-Mezencev | 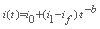 |
i1: infiltration capacity at the time t=1 min [cm/s]; t: time[s]; b: constant value. |
| Holtan | 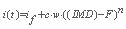 |
c: factor, varies between 0.25 to 0.8; w: scale factor of the Holtan equation; n: exponent, experimentally determined (close to 1.4.) |
| Horton | 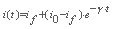 |
γ:
constant value function of the nature of the soil [min-1] |
Philip |
 |
s: sorptivity [cm.s-0.5]; A: gravitation component function of the hydraulic conductivity at saturation [cm/s] |
| Dooge |  |
α: constant value; Fmax: Maximum capacity of retention; Ft: Water content at time t. |
All equations in Table 3.3 have a common characteristic: after a certain time the infiltration curve tend asymptotically to become parallel with the x-axis to a constant value equal to the hydraulic conductivity at saturation. This characteristic is valid under the assumption that the infiltration is manifested in the vertical direction. Then, both the gravity force and the capillary one are active while in the case of the horizontal motion of infiltrated water, only the sorption force acts and the infiltration curve tend asymptotically to zero.
In the most general manner the runoff coefficient is defined as the ratio between the depth of runoff (net rainfall noted hn) and the rainfall depth (global rainfall noted hb), thus:
 |
(3.15) |
In any catchment the runoff coefficient depends on the amount of rainfall, its intensity and the initial conditions of the soil moisture, which is the soil humidity before the flood wave triggering rainfall. Starting from this concept, it results that the relationship between runoff and rainfall, expressed through the runoff coefficient, is derived only from the input elements and neglect the internal components of the physical process of runoff formation. In that case the runoff coefficient is regarded in a simplified manner as a constant value that reduces the triggering rainfall during its entire duration and regardless its time distribution. Although this type of model represents a simplified concept, it is often successfully used in practical applications. Moreover, a large category of practical hydrologists recommends deriving the runoff coefficient as a constant value during the triggering rainfall, function of the catchment parameters as for example the land cover, land use and/or the basin slope.
In order to improve this model, the concept of time variable runoff coefficient is introduced. The triggering rainfall is shared into discrete values across time intervals Δt1, Δt2,... Δtn (in form of a histogram) having successive intensities I1, I2 , …In. At the beginning of the first time interval, the initial soil humidity depends on the amount of antecedent precipitations fallen around the basin. The runoff coefficient in the first time interval would depend on the initial soil humidity W1 and the rainfall intensity I1. Therefore, the runoff intensity over the first time step Δt1 would be R1=α1I1 and the soil moisture at the end of the first time interval is increased with the remaining rainfall that infiltrates into the soil during that time. The new value of the runoff coefficient over the Δt2 interval would depend on the newly produced conditions at the beginning of the second time and this will be different from that was established across the first time interval and the reason goes on for the subsequent time steps. Thus, in this model the runoff coefficient is considered as a variable value across the entire duration of the rainfall that generates the flood wave.
Taking into account these two alternatives, the methods for deriving the runoff or effective (net) rainfall will be further treated as constant runoff coefficient methods and variable runoff coefficient ones.
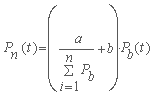
One of the simplest relation for deriving the constant runoff coefficient is based on the amount of total precipitation Pb, and has the form (Jaton,1982):
 |
(3.16) |
where a and b are coefficients of the regression line, the equation of which is written as :
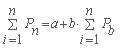 |
(3.17) |
This equation is nothing else but the regression equation between the cumulative rainfall and the cumulative effective rainfall Pn. The runoff coefficient is written further as:
 |
(3.18) |
Then, the relation that gives the effective rainfall at the moment t is:
 |
(3.19) |
In order to illustrate the derivation of the runoff coefficient, based on records of rainfall and the corresponding runoff events, an example is given below (Musy, 1998). A series of rainfall-runoff events recorded in the catchments Parimbot (37 events between April 1984 and October 1987), Haute Mentue (30 events between May 1987 and October 1988) and L'Arbogne (36 events between October 1984 and July 1988) have been considered (Consuegra, 1992).
A direct relationship between the runoff coefficients was determined, according to equation 3.13, for each event and the global rainfall generating the runoff, and shows a great scatter of points. This scatter is explained by the absence of the antecedent soil moisture conditions in this relationship.
It is possible to make a regression between the cumulated global rainfall and the cumulated effective rainfall (runoff). So a good relation is obtained and it is then possible to determine the runoff coefficient function of the cumulated global rainfall, as given in relation 3.15.
An improved model for deriving the constant runoff coefficient is the relationship with both the amount of precipitation fallen in a runoff-generating event and an index of antecedent precipitation. A function of antecedent precipitation that falls priory to the rainfall event triggering the flood wave would represent an index of the soil moisture status before the rainstorm occurrence. The further assumptions are deemed:
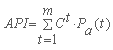
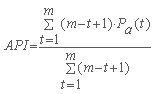
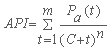
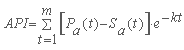
Taking into account these two assumptions it results that the earlier the antecedent precipitation, the smaller its influence. Following this reasoning each antecedent precipitation should be reduced with a weight factor that becomes smaller in so far as the precipitation occurs longer time. This concept results in the notion of "Antecedent Precipitation Index" noted as API and it expresses the water retention in the soil at the moment of the rainfall occurrence. The most commonly used relations for deriving the API are given below (Stanescu et al., 1983):
 |
(3.20) |
 |
(3.21) |
 |
(3.22) |
 |
(3.23) |
| where: | ||
| API | Antecedent Precipitation Index at the time t=1, 2,…m, so that t=1corresponds to the day before the flood wave triggering rainfall and so on, m<10 days (usually, m=5 days), | |
| C | constant equalling 0.9 to 0.95, | |
| k | parameter determined for the considered basin, | |
| Sa(t) | depth of runoff that results from the antecedent precipitation Pa(t). | |
According to Jaton & Chambouni (1984) a recurrent formula for assessing the API has the following form:
 |
(3.24) |
where K = 0,8 - 0,9
Other authors proposed three situations with characteristic limits for API, as follows:
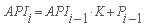
Befani and Kalinin (1983) proposed a relationship between the runoff coefficient, the total amount of rainfall (Pb), and the API. This relationship is given in the Figure 3.9.
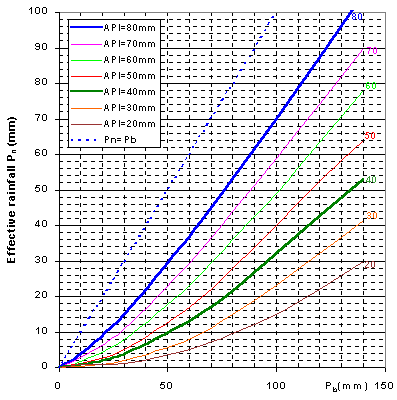
Figure 3.9 Relationship between the runoff coefficient, total rainfall, and API.
Girard (1970) proposed the following possible analytical expression:
 |
(3.25) |
Stanescu (1983) considered a relationship between the runoff coefficient, the total amount of precipitation and the API, as:
 |
(3.26) |
where: a, b, and c are parameters.
Another type of graph that gives the constant runoff coefficient is the co-axial-type graph, where the runoff coefficient depends on a multitude of meteorological parameters, namely:
The coaxial-type graph is presented in the Figure 3.10.
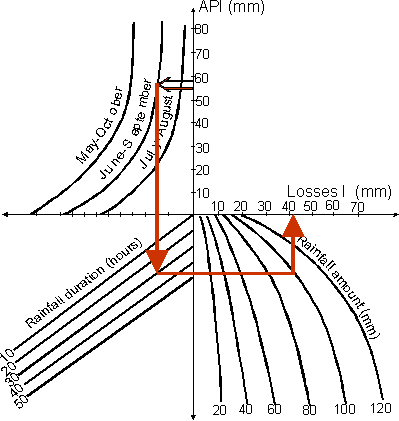
Figure 3.10. Co-axial graph for determining the effective rainfall.
In this graph the losses I are explicitly determined, so that the runoff coefficient is:
 |
(3.27) |
After determining the runoff coefficient as a constant value, the following procedures are used for reducing global rainfall to effective rainfall.
The index Φ is defined as the average infiltration capacity that, for a certain rainfall, is considered as a constant value in time. Above this infiltration capacity the surplus of the precipitation is considered as effective rainfall. As seen in Figure 3.11 this index is obtained by drawing a parallel line to the time abscissa so that the area of the hyetograph above this line would represent the effective rainfall. This index integrates all the losses that occur in the process of runoff formation: interception, retention, evaporation and infiltration. For the rainfall values having significant depths, interception and retention in depressions might be neglected.
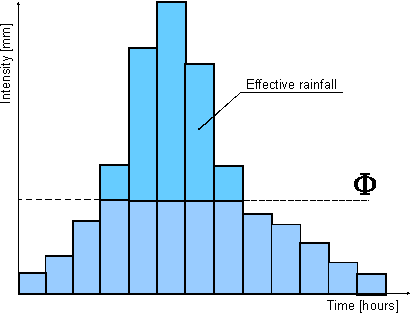
Figure 3.11. Method of the Φ index
The proportional distribution consists in allocating the losses during the rainfall event proportionally to the quantities of precipitation fallen in each time interval Δt. The increments of the effective rainfall are obtained by reducing the increments of the global rainfall by the runoff coefficient, as in Figure 3.12.
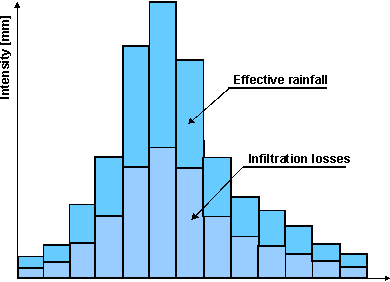
Figure 3.12. Method of W index (proportional distribution of losses)
When the saturation conditions of the soil are attained the infiltration capacity becomes constant. Further on, the retention capacity of the catchment becomes minimal and the index Φ and W are approximately equal. On this observation Alexeev proposed a method where the initial losses are expressed as a function of the average infiltration rate and a climatic parameter γ. Initial losses consist of filling the soil micro-cavities, the soil wetness and the infiltration. According to the author of the method, the initial losses L0 for "black soils" of forest and steppe are comprised between 15-20 mm. The parameter 1/γ might represent the duration along which the infiltration capacity of the basin equals its average value.
Noting im the average infiltration capacity the following relation is written:
 |
(3.28) |
where γ is the climatic parameter varying between 0.03 and 0.06 in the studied regions considered by Alexeev. The average infiltration capacity varies between 0.2-0.3 mm/minute for clay soils and 1.5 mm/minute for sandy soils. For other types of soil the depth of the initial losses are presented in Remenieras (1965).
The application of the method of W minimum index is presented in Figure 3.13. First, initial losses are subtracted at the beginning of the rainfall. Then, the infiltration capacity at saturation im is applied and thereafter the global rainfall is reduced by proportional losses so that the total losses would be represented by the runoff coefficient.
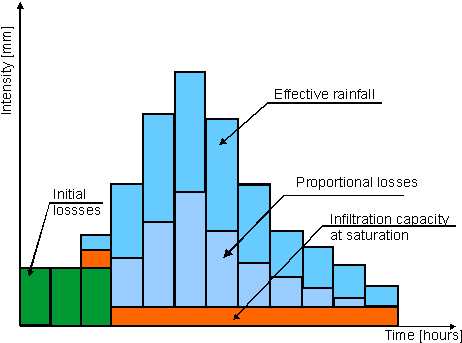
Figure 3.13. Method of the Wmin (Alexeev)
This method is based on the SSARR (Streamflow Simulation And Reservoir Regulation) model derived by US Army Corps of Engineers (1960). According to this method across each time interval Δt the effective rainfall is determined as a portion α(t) from the global rainfall. (Figure 3.14).
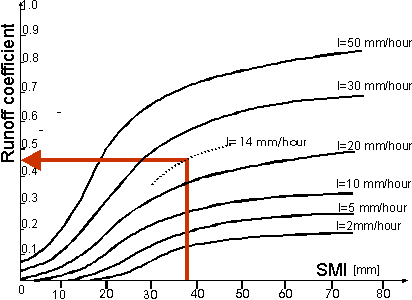
Figure 3.14. The SSARR curves
The portion is the variable runoff coefficient determined from an empirical relation as a function of the global rainfall intensity (mm/hour) across a time interval and the soil moisture content (mm) at the beginning of each time interval.
Across each time step the effective rainfall intensity (mm) is given by the relation:
 |
(3.29) |
At the first instance of the commencement of the triggering rainfall the initial soil moisture is considered as equal to API, computed by one of the above-presented formulae. For the next moments t:
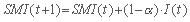 |
(3.30) |
This method starts from the observation that the points representing the overland flow volumes are found above a line having a unit slope. The overland flow might be inferred whether the type of soil and its canopy, the API and the rainfall duration are considered. Starting from these remarks, Mockus proposed (Musy, 1998) a relation where the parameters are expressed in the form of indices.
The following estimates are defined:
The graphical representation of these variables is shown in Figure 3.18 where the ordinate is marked by the intensity i representing each of the above-mentioned estimates.
One makes the hypothesis that the sum of the curves representing the cumulative precipitation and those representing the cumulative infiltration is constant. Thus the curves shown in Figure 3.18 are symmetrically placed in regard to a parallel to the abscissa passing through the point O marked in Figure 3.18.
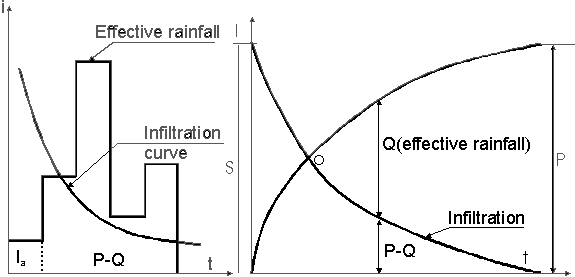
Figure 3.15. The SCS Method
Applying the rules of elementary geometry regarding the similar triangles the following relation might be written:
 |
(3.31) |
The effective precipitation is expressed from 3.31 as:
 |
(3.32) |
Introducing the initial losses Ia the term P becomes P-Ia and the previous equation becomes:
 |
(3.33) |
After performing many analyses the Soil Conservation Service proposed an empirical relation linking the initial losses Ia to the maximum potential losses noted :
 |
(3.34) |
Finally, the expression of the effective rainfall is given by:
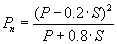 if P>0.2S
 |
(3.35) |
In order to standardise the curves representing the effective rainfall function of the rainfall, the SCS introduced a non-dimensional parameter called "Curve Number" denoted by CN, so that 0<CN<100. This parameter reported in metric units is expressed as:
 |
(3.36) |
In compliance with the antecedent conditions of the soil moisture there are:
1. Normal conditions: 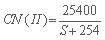
2. Dry conditions: 
3. Wet conditions: 
Finally SCS established the relations between the estimates of the Curve Number and the land use type. In Table 3.4, values of CN are given for normal conditions of the soil moisture CN(II) and for the initial losses Ia = 0,2.S.
On the basis of the previously established equations, the expression of the cumulative infiltration can be derived. The cumulative infiltration F is written as:
 |
(3.37) |
 |
(3.38) |
Replacing this equation by the equation 3.32 one obtains:
 |
(3.39) |
Table 3.4 Values of the CN for normal conditions of soil humidity
(Chow, 1988)
| Land cover | Categories of soil | |||
|
A |
B |
C |
D |
|
| Cultivated, well maintained soil | 72 |
81 |
88 |
91 |
| Cultivated, bad maintained soil | 62 |
71 |
78 |
81 |
| Pasture in good conditions | 68 |
79 |
86 |
89 |
| Pasture in bad conditions | 39 |
61 |
74 |
80 |
| Prairie | 30 |
58 |
71 |
78 |
| Low dense forest | 30 |
58 |
71 |
78 |
| High dense forest | 25 |
55 |
70 |
71 |
| Parks, golf terrain, sport terrain, cemetery covered
with grass |
39 |
61 |
74 |
80 |
| Commercial zones (85% impermeable areas) | 89 |
92 |
94 |
95 |
| Industrial zones (72% impermeable areas) | 81 |
88 |
91 |
92 |
| Residential areas: Portion of impermeable area: |
77 |
85 |
90 |
91 |
| Parking, roofs | 98 |
98 |
98 |
98 |
| Roads |
98 |
98 |
98 |
98 |
In equation 3.39 the components S and Ia are constants while the estimates P and F depend on the time t. It follows that the infiltration rate i(t) might be obtained by deriving the above-written equation with time, thus:
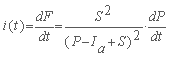 |
(3.40) |
This infiltration function is graphically represented in Figure 3.16 in the case of a constant rainfall intensity
Figure 3.16 Intensity of the infiltration rate function of the duration
An interesting approach to the application of the SCS method is to link the variable S given by the index CN (relation 3.33) with the Antecedent Precipitation Index API.
The production function plays an outstanding role in determining the flood wave resulting from a rainstorm. The main component of the water losses is the infiltration but nevertheless the other components of the water balance might be important under special circumstances. Among the methods presented in this chapter two categories might be distinguished: those that are physically based and the empirical ones. The methods of the first category are of course conceptually proven but the assessment of their parameters requires a great amount of data derived from measurements, and time costing computations. Moreover, the parameters that signify permeability features refer to isotropy, which is not the case for medium and even small-sized basins. Such procedures might be used for particular cases where the isotropy can be assumed without major consequences on the accuracy of the results.
On the contrary, the empirical methods based on the runoff coefficient concept, either being constant in time or variable, are based on the antecedent soil moisture concept. This one is based on the function of depths of rains that have fallen on the basin before the triggering rainstorm. Under the circumstances where antecedent rainfalls are very uneven distributed around the catchment, "an average value" of them across the basin is not able to reflect the complex conditions of the soil moisture. In this case the split of the basin area into subbasins is preferable for considering the average over space of antecedent rainfalls.
Unless use of complex conceptual mathematical models, for example those based on the principle of "reservoirs", the runoff coefficient based methods still remain in many cases powerful and simple tools for effective rainfall assessment. The main condition of successfully applying them is to be adapted to the peculiarities of the flood wave formation in a basin.