Rocks are aggregates of one or more minerals, whose nature and proportion determine the characteristics of the whole rock. According to their genesis and geological history, three main classes of rocks have been defined:
The porous media are usually three - phase media that means the coexistence of the three phases:
The solid phase of the soils is represented by the accumulation of mineral particles resulted from the weathering of parental rock; the remaining void space between the particles contains water and/or air.
The formation of soils from an existing rock (either igneous or metamorphic) is explained by the action of several destructive processes, which could be physical, chemical or biological, and it is based on the different stability of constitutive minerals under the atmospheric conditions (low temperatures, low pressures, high humidity). The physical destructive process may be caused by the erosive action of wind, water or glaciers, or disintegration caused by cycles of freezing - thawing of water located in the cracks or in the pores of the rock. The particles resulted after physical processes keep the same composition as that of the parental rock and they have a granular structure, being more vulnerable to be transformed by subsequent chemical processes, as follows.
The chemical processes of disintegration lead this time to major changes in the mineral structure of the parental rock. The stability of the minerals existing in the structure of parental rock under weathering conditions is different, depending on the mineral crystallization temperature from magma. As the temperature decreases below the crystallization temperature, the structural stability also decreases. Therefore, the most unstable mineral has the highest crystallization temperature (olivine), and the most stable has the lowest one (quartz). This explains why quartz is the most encountered nonclay mineral in the soils. Due to this different electrochemical stability, the minerals existing in the parental rock (known as primary minerals), have been transformed by chemical weathering into particles of colloidal size (< 0.002 mm), known as secondary minerals or clay minerals, intercalated among the remained undiscomposed minerals. This phenomenon is schematically suggested in Figure 1.1
Figure 1.1 Simplified scheme regarding the clay and grainy sediments
genesis, started from the chemical
weathering of a same parent rock and deposited
then after water transport.
a) primary minerals in the rock composition; b) primary and secondary minerals
after weathering;
c) primary and secondary minerals after sedimentation.
The clay mineral particles are of different shapes, from bars, plates and sheets, with amazing specific surface Ssp=A/V (the ratio of surface area to volume, being for example between 10-70 m2/cm3 for kaolinite, till 500-1500 m2/cm3 for montmorillonit).
The clay minerals are silicates and their basic structural units consist of a silica tetrahedron and an alumina octahedron schematically represented in Figure 1.2a.
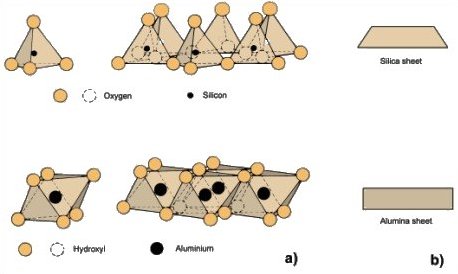
Figure 1.2. Basic units of clay minerals and the silica and alumina sheets (from Mitchell, 1993)
These basic units are combined to form sheet structures represented symbolically in Figure 1.2b. It is important to notice that a lot of electric charges remain unbalanced in these sheets. Different cations and water dipoles are available to satisfy these unbalanced electric charges creating thus real bonds and joining the sheet structures above mentioned. For this reason, the various clay minerals are formed by the stacking of combinations of basic sheet structures with different forms of bonding between the combined sheets. Such structures of the main clay minerals are represented in Figure 1.3.
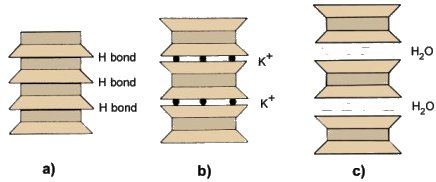
Figure 1.3. Structure of the main clay minerals: (a) kaolinite, (b) illite and (c) montmorillonite, based on combined sheets (from Craig, 1990)
The negative electric charges which have remained unbalanced on the contour around clay particles are an attraction for water dipoles and cations, generating together a superficial layer called adsorption complex (see Figure 1.4).
This particular structure of clay minerals and the negative electric charges which have remained unbalanced on high contour surfaces confer great activity in the relationship with water and explain a lot of particular clay properties, such as: cohesion, matrix suction, low permeability, swelling-shrinkage behavior, etc.
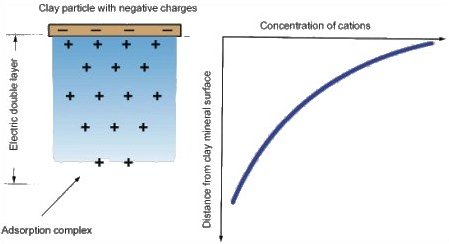
Figure 1.4. The absorbtion complex created at the surface of a clay particle (modified after Cernica, 1995)
The most encountered clay minerals in nature are (Figure 1.5): kaolinite, halloysite, illite, vermiculite, montmorillonite, etc. Some images made at the electron photomicrograph put into evidence the major structural differences between granular minerals (Figure 1.6), explaining thus their behaviour as porous medium.
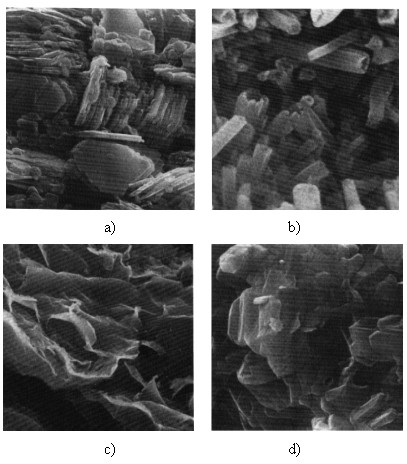
Figure 1.5. Clay minerals (from Mitchell, 1993 after Tovey,
1971)
a) Kaolinite; b) halloysite; c) montmorillonite d) illite
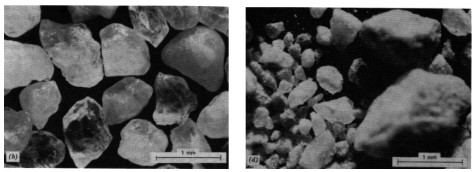
Figure 1.6. Granular particles (from Mitchell, 1993, courtesy of K. L. Lee)
As it can easily be seen from these photos, as the size of particles decreases, the volume of pore spaces is bigger, but the adsorption complex of each particle occupies an important part of this volume. This explains the low permeability of clays in comparison to sands in spite of their higher porosity.
After the chemical weathering the resulted products remain in their original location; such generated soil is called residual soil. The residual soils usually appear in areas where there have never been conditions of soil transport. Wide exposure at excessive atmospheric conditions (temperatures and humidity) facilitate and accelerate the weathering processes. The topsoil is the most common example of residual soil. In tropical regions the phenomenon of soil formation is more accute and more rapid. A typical profile of a residual soil is presented in Figure 1.7.
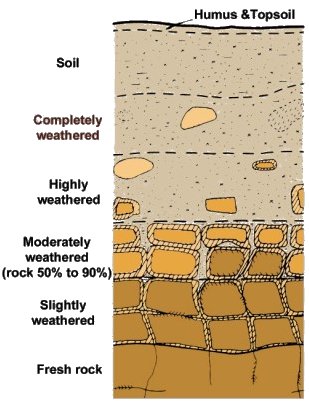
Figure 1.7. Typical profile of a residual soil (from Fredlund, 1993 after Little, 1969)
In most cases, the clay particles do not remain at the site of their formation. A lot of factors have a significant contribution to the transport of these particles (water, wind, glaciers), resulting in the transported soil. In most cases a sedimentation process generates the clay masses.
Because of the great sensitivity to water, which resulted from their chemical composition, and because of their great specific surface at microscopic level, the clay particles are also very sensitive to the chemical composition of the water in which the sedimentary process takes place. The presence of different solutes in the sedimentary water produces serious changes in the structure of clays (Mitchell, 1993).
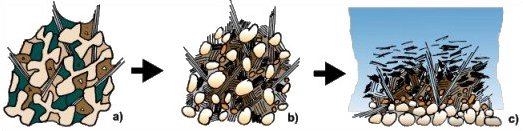
In Figure 1.8 is shown an example about how a concentration of only 0.5 N of NaCl in the sedimentation water can drastically influence the structure of the resulted clay mass (kaolinite, illite and montmorillonite). This phenomenon explains the collapsible behavior of quick clays, which have been sedimented in the seawater.
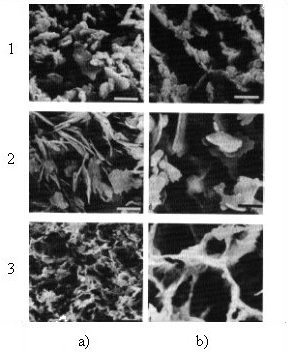
Figure 1.8. Comparative image of the structure of kaolinite (1), illite (2) and montmorillonite (3) resulted from: a) sedimentation in distilled water and b) 0.5N NaCl solution (from Mitchell, 1993 after Osipov and Sokolov, 1978)
The repulsion and attraction forces between clay mineral particles in specific conditions of sedimentation can generate different kinds of structures for the same clay mineral (Figure 1.9). This structure can be defined as: dispersed (a), flocculated (b), bookhouse (c) and turbostratic (d). The natural structure of clay is actually a complex combination of all these basic structures, including granular particles of silt or sand (Figure 1.9e).
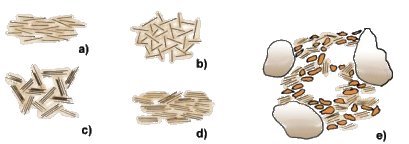
Figure 1.9. Clay structures: dispersed (a), flocculated (b), bookhouse (c), turbostratic (d) and the natural structure of clay (after Craig, 1990)
Schematic representations of particle assemblages are given by Collins and McGown (1974) and by Mitchell (1993), as can be seen in Figure 1.10 (click to enlarge).
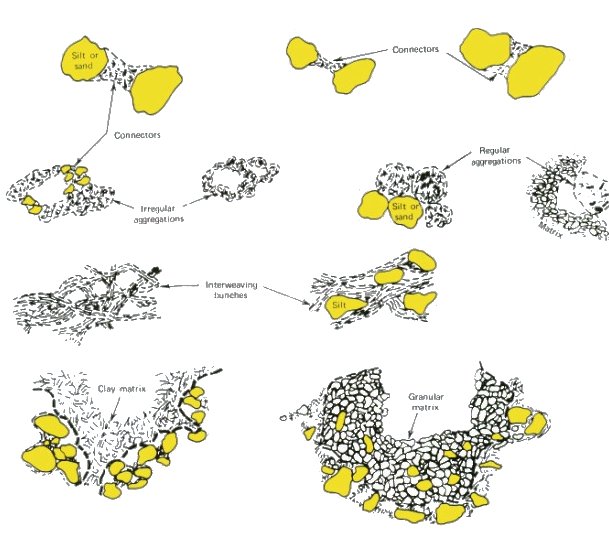
Figure 1.10. Schematic representations of particle assemblages (from Mitchell, 1993 after Collins and McGown, 1974)
It is interesting to notify that each kind of structure mentioned above involves particular porous space shape and structure and consequently, a lot of particularities in the mechanical and hydraulic characteristics of the entire material. In Figure 1.11 the main pore space types resulted from the complex particle assemblages are given by same Collins and McGown (1974) and Mitchell (1993).
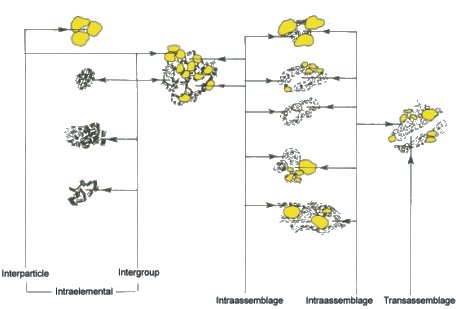
Figure 1.11. Schematic representations of porous space structure related to particle assemblages (from Mitchell, 1993 after Collins and McGown, 1974)
After the dewatering of the site and the drainage of the sediments a complex process of consolidation together with cementation of particles is started. The carbonates, oxides precipitated or organic matter can generate weak cementation among the particles.With time, the sedimentary rock becomes older and, under the consolidation and cementation processes, a sedimentary rock with better mechanical properties results. In the following, if such rock is exposed to extreme conditions (very high temperatures and very high pressures), in thousands of years it is transformed into metamorphic rock.
The size range of soil particles resulted from both physical disaggregating and chemical weathering is very large, ranging between several μm and almost 1 m. Both mechanic and hydraulic properties of the entire porous medium are depending on the sizes of soil particles. For this reason to establish the sizes of the soil particles and their percent in the composition of the soil is indispensable for a first characterization of the porous medium.
A particle size analysis of a soil requires determining the percentage by weight of particles within the particle size ranges. The particle size distribution curve of a soil represents the weight percentage of the total weight, of all particles smaller than any given diameter vs. that diameter. In other words, the particle size distribution curve of a soil can be plotted using the size of the soil particles on the abscissa on the logarithmic scale, and on the ordinate, on the arithmetic scale, the weight percentage of soil particles not exceeding this size.
Because of the wide range of soil size particles and of different cementation degrees, a particle size analysis can be made in two ways: by the method of sieving and by the method of sedimentation.
The particle size distribution of a coarse-grained soil, uncemented and cohesiveless, can be achieved by the method of sieving. The whole quantity of soil is passed through several standard test sieves ordered successively by smaller mesh sizes. The quantity of soil retained on each sieve is weighted and the cumulative percentage that passed each sieve is calculated and then represented vs. mesh size of the sieve.
The particle size distribution of a fine-grained soil, cohesive and low cemented can be determined by the method of sedimentation. A soil suspension is prepared in distilled water and a deflocculating agent is added in order to disaggregate any bound between soil particles. The principle of the method is based on the different velocity of particle sedimentation depending on their size. The velocity of sedimentation is proportional with the size of particles. Therefore, the unit weight of the soil suspension decreases in time because of the sedimentation process.
A mixed analysis is available for soils having both kinds of particles, and finally a single curve may be plotted based on these two analyses.
In Figure 1.12, several particle size distribution curves are represented, together with a classification of soils derived from such analysis. It is important to notice that this classification has been made after the British Standard, but this system is not universally adopted.
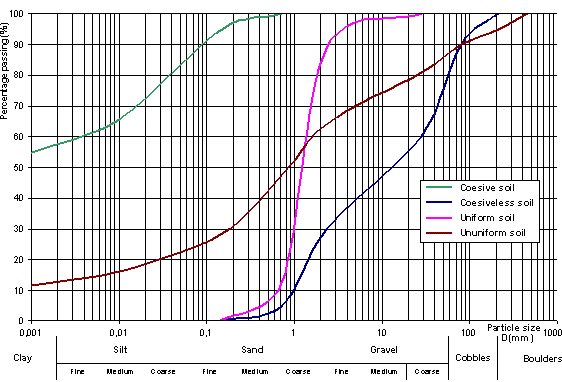
Figure 1.12. Particle size distribution curves and classification according to British Standard
As the distribution curve is more flat, the range of particle sizes in the soil is wide and the soil is considered as ununiform; a steeper curve characterizes a narrow size range of particles, i.e. an uniform soil. In order to have an indication about the uniformity of the soil, a coefficient of uniformity Cu (attributed to Allen Hazen) is introduced, defined as:
 |
(1.1)
|
where D10 is the size such that 10% of the particles are smaller than that size, and D60 is similarly defined for 60%. The D10 is known as the effective size because it controls the water flow in sands. The coefficient of uniformity Cu may be assumed as the inverse slope of the particle size distribution curve in its middle part considered as the most representative for the soil. As the coefficient of uniformity is higher, the range of soil particle sizes is larger, and the soil is more ununiform. Usually, the soils considered as uniform are those whose coefficient of uniformity is less than 4.
A coarse-grained soil is considered as well graded if there is no surplus of particles in any size range and if no intermediary sizes are missing. Usually, a flat, concave distribution curve corresponds to a well-graded soil. On the contrary, a coarse-grained soil described as poorly graded is characterized by a high percentage of the particles having sizes within narrow limits (a uniform soil) or if particles of both large and small sizes are present but, which relatively lack intermediate size particles (a gap-graded soil). The uniformity of soils is important in the explanation of scour phenomena of the fine-grained particles through big pores.
The general shape of a distribution curve could be described by using the so-called coefficient of curvature (CC) or coefficient of concavity, defined as follows:
 |
(1.2)
|
where the signification of diameters is the same presented above. For a well-graded soil the coefficient of curvature is comprised between 1 and 3. For values out of this range, the soil can be considered as poorly graded.
The pore sizes, shapes, distributions and communication ways control all mechanic and hydraulic properties of the porous media such as conductivity, deformation behavior, anisotropy, etc. All of these characteristics of the pore systems are derived from the texture of the soil or of the rock masses. The next scheme (Figure 1.13) is just a selection from the wide range of such cases; in images (a) and (b) it can be seen how the uniformity of the particle size and their proportion in granular materials can influence the structure of pores. In fractured media, as it can be seen in images (c) and (d), the origin of discontinuities, their communication, opening and orientation are determinant in the hydraulic behavior.
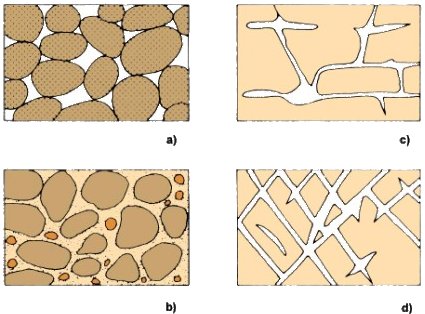
Figure 1.13. Influence of structure and texture of the porous medium on porosity: a) poorly graded uniform granular material which particles have their own porosity system; b) well graded granular material with small particles filling the big pores; c) partially closed discontinuity systems appeared in an intact porous rock due to active water; d) open discontinuity systems appeared in an intact rock due to mechanic fracturing. (from Freeze and Cherry, 1979 after Meinzer, 1923)
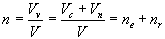
The main feature of the porous space, widely accepted, is the porosity and one of the main problems in the groundwater field is the assessment of an equivalent porosity of a global porous medium.
The porosity (n) is defined as the ratio of the volume of voids (Vv ) to the total volume (V ) of the soil sample:
 |
(1.3)
|
where Vs is the volume of the solid particles.
Usually the porosity is expressed by percentage:
 |
(1.3')
|
If the mechanical properties of the porous media are depending on this porosity, the flow properties of the porous media are additionally determined by the degree of interconnection of pore spaces. Not interconnected and dead-end pores do not allow water flow. If the volume of voids (Vv) contains both communicating (Vc) and noncommunicating (Vn) voids, the above relationship defining the porosity can be written as:
 |
(1.4)
|
where ne is the ratio of communicating voids to the total volume and represents the effective porosity and nr is the residual porosity (the ratio of noncommunicating voids to the total volume). In underground flow problems only the effective porosity allow the flow of water.
Moreover, for practical reasons the effective porosity could be divided on macroporosity, which is actually responsible of the great water flow through soils and microporosity, which allows the capillary water movement. In many cases, an additional fracture system can increase the initial macroporosity. That is the case of shallow heavy clay masses, dried and fissured because of the shrinkage behavior under variable weather conditions. Such an induced discontinuity system is equivalent to macroporosity increasing.
The void ratio (e) represents the ratio of the volume of voids (Vv) to the volume of solid particles (Vs):
 |
(1.5)
|
Based on the relationships (1.3) and (1.5), and considering the total volume of soil as the sum of voids volume and solids volume, both porosity and void ratio can be expressed as follows:
 |
(1.6)
|
 |
(1.7)
|
For many soils, especially for silts and clays, the volume of voids can exceed several times the volume of solid skeleton. For this reason, in comparison with the porosity, the void ratio can have a wide range of values, usually varying between 0.3 and 3.0. In the next table, range of porosity values for several of most encountered soils and rocks are presented with the explanation that these values are deeply affected by the degree of compaction.
Table 1.1 Usual values of porosity for several soils and rocks
|
Type of soil or rock
|
Porosity n (%)
|
| Unconsolidated deposits | |
| Gravel | 20 – 35 |
| Sand | 25 – 50 |
| Silt | 35 – 50 |
| Clay | 40 – 70 |
| Rocks | |
| Fractured basalt | 5 – 50 |
| Karst limestone | 5 – 50 |
| Sandstone | 5 – 30 |
| Limestone, dolomite | 0 – 20 |
| Shale |
0 – 10 |
| Fracture cristalline rock | 0 – 10 |
| Dense cristalline rock | 0 – 5 |
It is important to notice that, as the particle sizes of a soil are smaller, the porosity and the void ratio increase. Amazing or not, gravels for example have porosity values much smaller than those of clays, in spite of the size of the pores.
The groundwater flow modeling through a real porous medium is based on the assumption of a perfect porous equivalent continuum medium. In order to make this equivalence in good conditions, it is very important to establish the theoretic porosity of the medium, which simulates the real flow as well as possible. If this porosity is established based on small volume samples, it is very possible to randomly select either a too low or a too big porosity. The volume of the sample is not representative in order to allow the characterization of the whole soil mass porosity. A bigger sample is necessary. The minimum volume randomly selected, which keeps the porosity features of the entire volume of the site, is called Representative Elementary Volume (REV). Increasing the sample volume over this representative elementary one, the porosity feature has to remain almost constant.
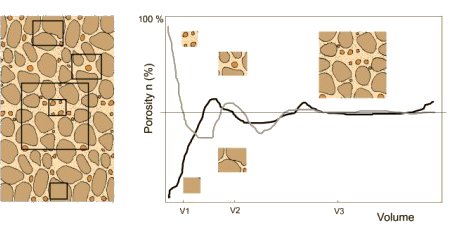
Figure 1.14. Representative Elementary Volume (modified after Bear, 1972)
For the porous medium represented in Figure 1.14, the small volumes V1 and V2 randomly selected do not characterize the entire volume of the site, thus there are not representative. Beginning with the V3 volume the porosity becomes relatively constant, and thus representative.
For very large volumes, the representative feature is lost because of the inherent heterogeneity of the considered domain.
The density of the solid soil particles (ρs ), can be defined as:
 |
(1.8)
|
| where: | ||
| Ms | mass of the solid particles dried at a temperature of 105 °C | |
| Vs | volume of the solid particles | |
The bulk density ρb of a certain soil in natural conditions represents the ratio of the total mass M to the total volume V:
 |
(1.9)
|
| where: | ||
| ρb | density of the soil in natural conditions | |
| M | mass of the soil in natural conditions | |
| V | volume occupied by the soil sample (m3) | |
It is important to note that this relation is defined for a homogeneous soil. For a heterogeneous soil the former relation leads to the average density of the material if the volume V is sufficiently large. The local density of a material may be computed using an elementary volume DV, taken as small as its properties may be assumed to be constant.
The dry density ρd of the soil is the ratio between the mass Ms of the soil dried at a temperature of 105°C and the volume V of the sample:
 |
(1.10)
|
The unit weight (γb) in natural conditions is defined as the total weight G (as force) per the total volume of the sample:
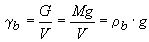 |
(1.11)
|
Because of their compaction degree, the granular soils usually have wide range into which the void ratio values may be located. Therefore, it is necessary to characterize the position of the actual void ratio (e) between the limit values emax and emin. The relative density (Dr) is required to be defined as:
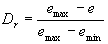 |
(1.12)
|
If the soil is in its densest possible state (e = emin) then the relative density of a soil is 1 (or 100%), while in its lowest possible state (e = emax), the relative density is 0.
Bibliography
Bear, J., 1978. Hydraulics of groundwater. McGraw-Hill, New York.
Cernica, J.N., 1995. Soil Mechanics. John Willey and Sons, New York.
Craig, R.F., 1987. Soil Mechanics. Chapman&Hall.
Fredlund, D.G. and Rahardjo, H., 1993. Soil mechanics for unsaturated soils. John Willey and Sons, New York.
Freeze, R.A. and Cherry, J.A., 1979. Groundwater. Prentice Hall, New Jersey.